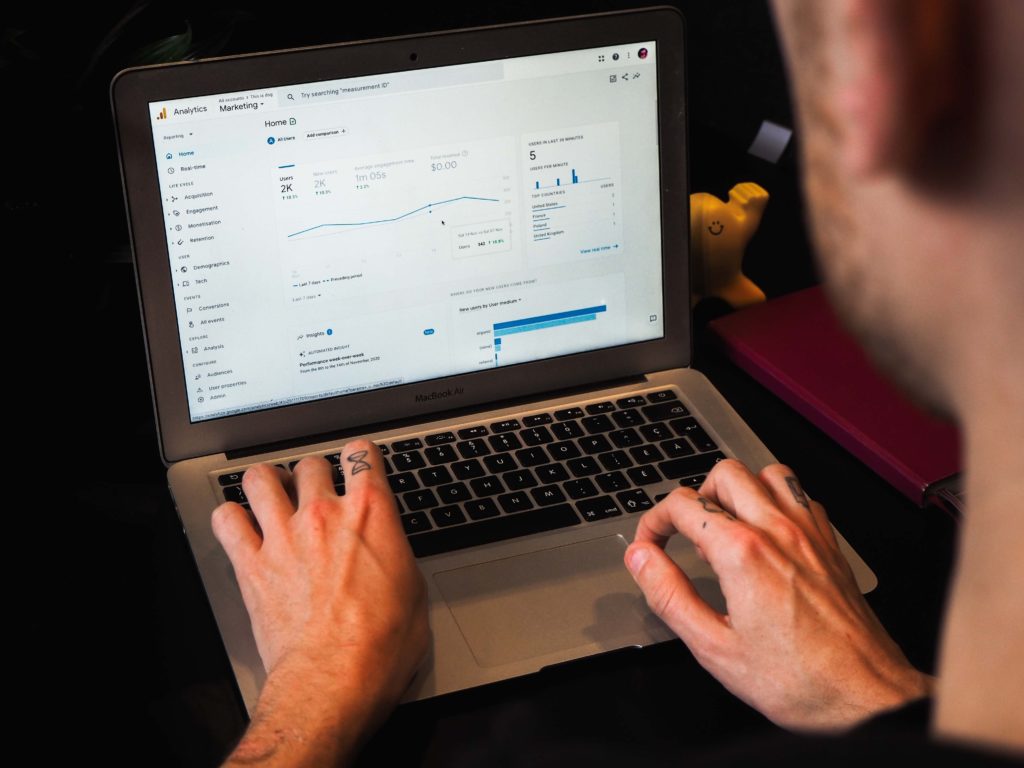
While ‘analytics’ may not be a word that everyone wants to hear, it is one that a successful website relies on.
By analysing the goings-on of your website and using the resulting data to improve user experience, you will have a higher chance of being recognised by Google and increasing site traffic.
What is Google Analytics?
Google Analytics is a free tool that tracks and reports on-site traffic to help you understand what visitors are doing on your website.
With Google Analytics, you can better understand your audience, analyse visitor behaviour and track total conversions, as well as access real-time data of user interactions with your site.
Understanding the Google Analytics Dashboard
Tracking your site data with Google Analytics is easy when you break it down into smaller steps. Luckily for us, that’s exactly what the popular search engine tool has already done.

Real-Time
The Real-Time feature enables you to see how many visitors are accessing your site as it happens – in ‘real-time’ – and what their interactions with the site look like.
Having access to a live view makes Real-Time an excellent marketing tool, as it reveals how users are responding to your current marketing campaigns.
Not only does Real-Time gauge how visitors to your site respond to marketing, but it also shows you how users are interacting with your website’s infrastructure. If it’s a positive user experience, visitors stick around. If not, they leave as quickly as they clicked in.
Audience
The Audience feature shows the total number of visitors to your site – and not just those visiting right now.
By selecting a time period (this could be anything from an hour through to a year), you can learn more about your site’s visitors and the interactions they have with your site while on it.
Amongst other things, this feature allows you to dissect and understand user demographics (like age and gender), as well as things like how long a user spends on your site and how many pages they visit.
Acquisition
Google Analytics’ Acquisition feature shows you where your website traffic is coming from and illustrates how visitors arrived at your site. It will also report on what users do while there, and the conversion rates linked to each different channel or platform of arrival.
The Acquisition tool also allows you to see where your users have clicked through to your site from. Whether they came directly (by typing in your URL) or from a search engine, social media platform, or email – just to name a few – you’ll be able to find out here.
By understanding where your visitors are coming from – or not coming from – you can direct your focus into improving the areas of low engagement and increasing the platforms that bring in most of your traffic.
Behaviour
The Behaviour feature shares insights on user engagement and their behaviour while visiting your site. This includes an overview of metrics like the total number of page views, the average time users spend on each page, and overall bounce rate.
It also highlights which pages people enter through and visit, an important factor in highlighting areas of interest, as well as which page of your site they exited from.
Analysing these metrics will help you understand the popularity of your web pages and whether or not the user experience is a positive one.
Conversion
Using the Conversion feature, you can set various goals for your website and see when or if they are met. When utilising this tool, it is important for you to configure the goal properly with all of the necessary information in order for Google Analytics to report back with accurate results.
There are 4 different goal types you can choose from:
- Destination: Loading a specific web page, such as the ‘Thanks for subscribing!’ page that loads after a user subscribes to your newsletter.
- Duration: The number of time users spend on your site before clicking out.
- Pages/Screens Per Session: The number of pages users view while on your site.
- EVent: Users perform a specific action, like playing a video or clicking on an ad.
Setting up goals can help you to monitor your site and make incremental improvements to improve your conversions – whatever that may be for your site – which work to improve your bottom line in time.
What Google Analytics can do for you
Google Analytics hosts a huge number of metrics that can help you better understand your site’s overall performance. Using the free insights it provides, you have the power to boost your marketing and SEO efforts and increase your return on investment (ROI).
Tracking your site data with Google Analytics will enable you to identify any holes in your marketing campaigns or website infrastructure. With this knowledge, you can create an action plan to tackle and resolve any issues, improve user experience and increase your conversions.


